Visualizer
The composer generates various output formats to visualize or inspect the topology.
tc compose -f <format>The following are some available formats
- json
- table
- tree
- digraph
- icepanel
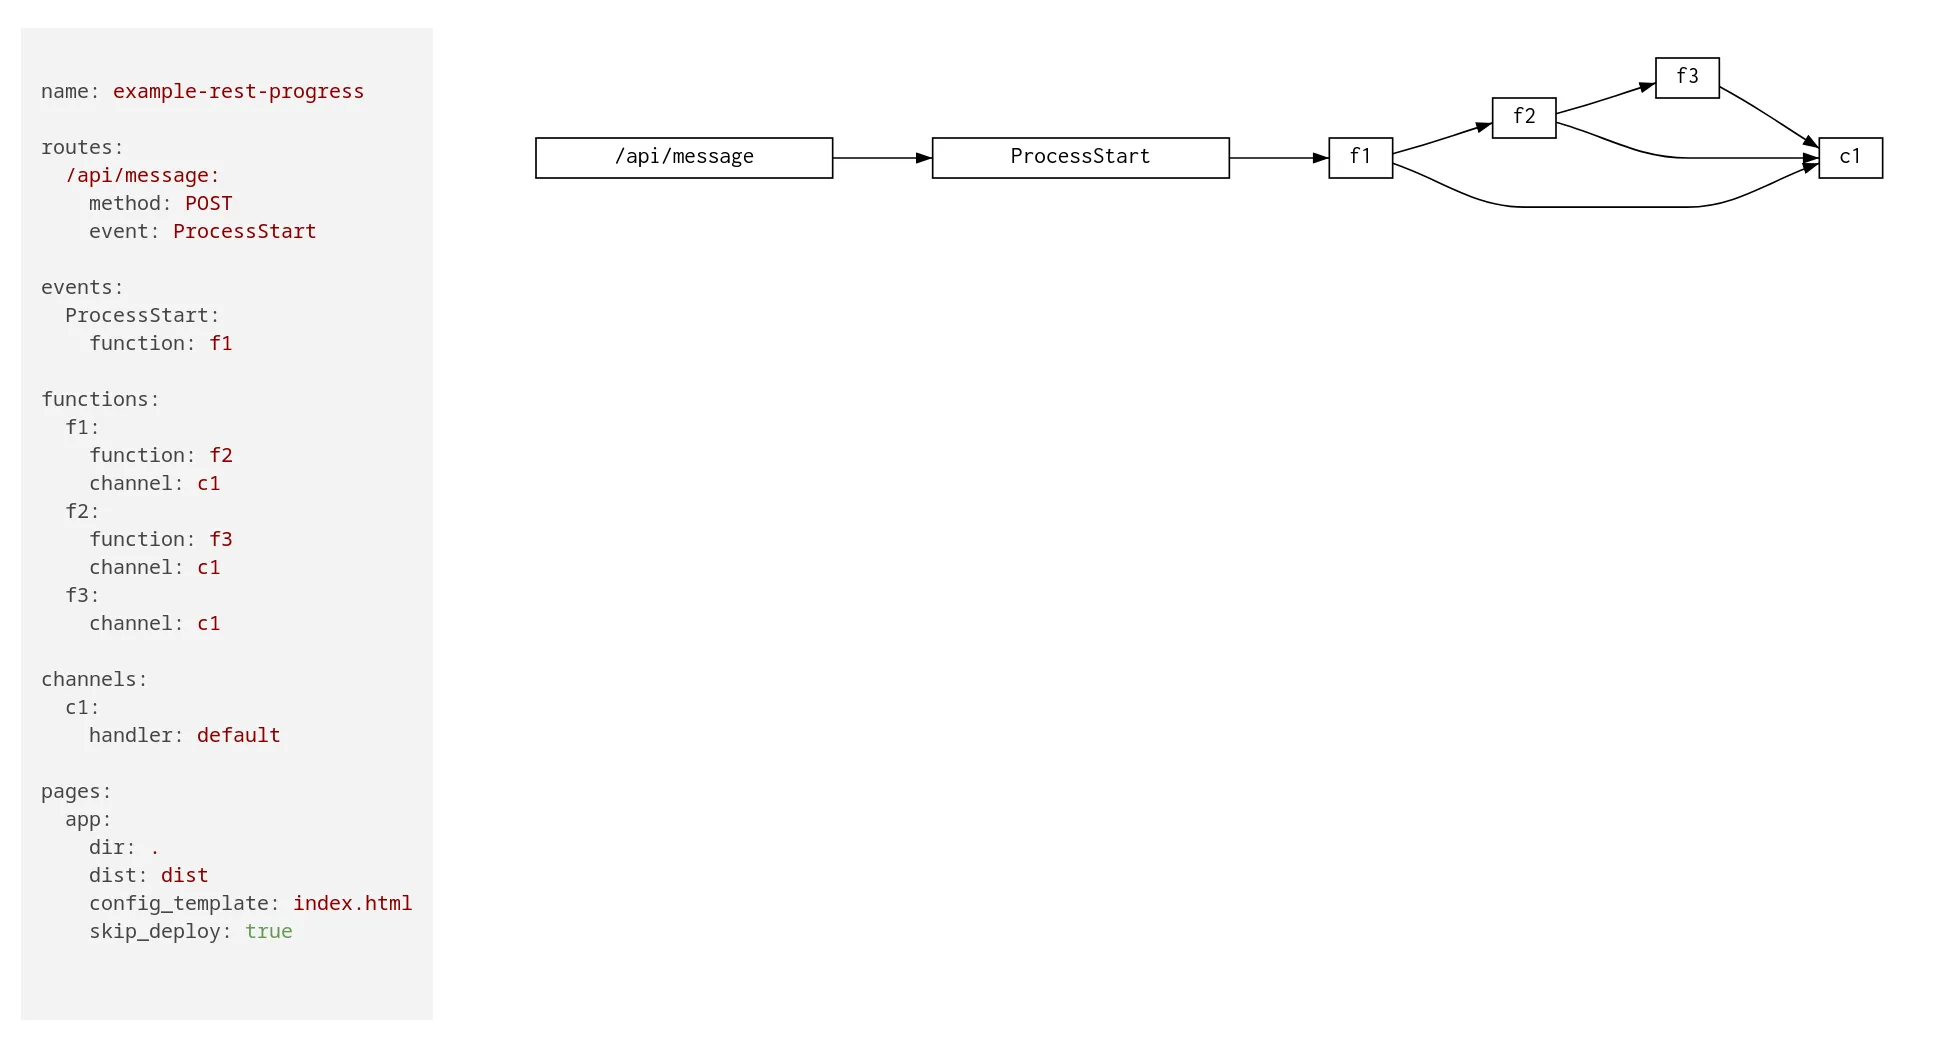
Let’s try various formats in examples/patterns/rest-async-progress
tc compose -f tree
example-rest-progress├╌╌ functions┆   ├╌╌ f3┆   ┆   ├╌╌ f3┆   ┆   ├╌╌ fqn: example-rest-progress_f3_{{sandbox}}┆   ┆   ├╌╌ role: tc-base-function-{{sandbox}}┆   ┆   ├╌╌ uri: examples/patterns/rest-async-progress/f3/lambda.zip┆   ┆   └╌╌ build: code┆   ├╌╌ f2┆   ┆   ├╌╌ f2┆   ┆   ├╌╌ fqn: example-rest-progress_f2_{{sandbox}}┆   ┆   ├╌╌ role: tc-base-function-{{sandbox}}┆   ┆   ├╌╌ uri: examples/patterns/rest-async-progress/f2/lambda.zip┆   ┆   └╌╌ build: code┆   └╌╌ f1┆       ├╌╌ f1┆       ├╌╌ fqn: example-rest-progress_f1_{{sandbox}}┆       ├╌╌ role: tc-base-function-{{sandbox}}┆       ├╌╌ uri: examples/patterns/rest-async-progress/f1/lambda.zip┆       └╌╌ build: code├╌╌ events┆   └╌╌ ProcessStart└╌╌ routes    └╌╌ /api/message
tc compose -f table entity | name | target_entity | target_name----------+------+---------------+------------- function | f1 | function | f2 function | f1 | channel | c1 function | f3 | channel | c1 function | f2 | function | f3 function | f2 | channel | c1We can also visualize the topology as dot SVG in a standalone HTML page by running tc visualize in the topology dir.